Map projections
Some days ago I worked with @pablompa solving a few problems with erroneous projections the Surveillance Data Processing System in SACTA was applying in some cases.
The work
Map projections is a large topic due to the number of possible projections to apply depending on what you intend to use them for. In ATM software one of the most common projections is the Stereographic projection, that allows you to draw aircraft positions on a flat screen in such a way that rhumb lines appear straight, as in a Mercator map.
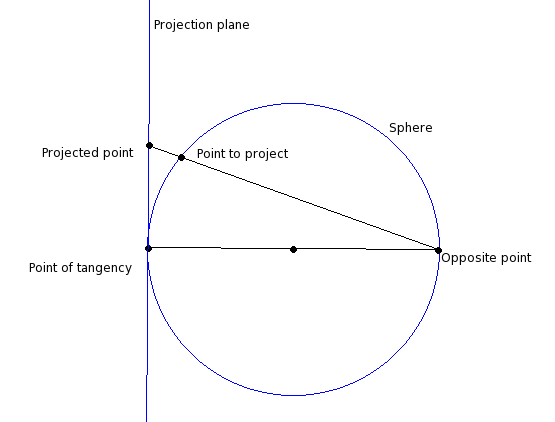
Stereographic projections are achieved by choosing a point of tangency on the surface of a sphere and drawing a tangential plane on it, which is going to be the screen plane. To get the position on the plane of a point in the sphere you cast a ray from the opposite sphere point going through the point, which intersects the plane at the projection point.
This distorts distance and speed as you get away from the point of tangency, and you’ll get scared when you realize you’re calculating distance and speed based on the cartesian projection, but anyway…
When you attempt to use the projection plane as the base of your coordinates system you need to translate coordinates between different planes all the time. For example, radars send you detections as a range and angle relatives to the radar position, probably with altitude information in case of a secondary radar. This detection point has to be projected to the earth surface, then to local coordinates relative to the radar and then to system coordinates in a somehow efficient way if you want to handle lots of traffic.
Another example is the ground speed received in ADS-B reports. This is ground speed information emitted by the aircraft together with its coordinates in the WGS-84 spheroid, relative to the plane at its position in the spheroid. It has to be projected to obtain the cartesian velocity in your system plane, which has been obtained from a conformal sphere at another point in the spheroid.
As you can imagine by now, things get hairy pretty quickly. It’s quite easy to get right if you don’t lose track of what you’re doing and ask yourself the right questions when processing geometry data. But if you code or write requirements oblivious to the matter without taking a bit of time to think, you’ll get it wrong.
The fun
All this work renewed my interest in map projections and I even recalled an xkcd comic on the matter.
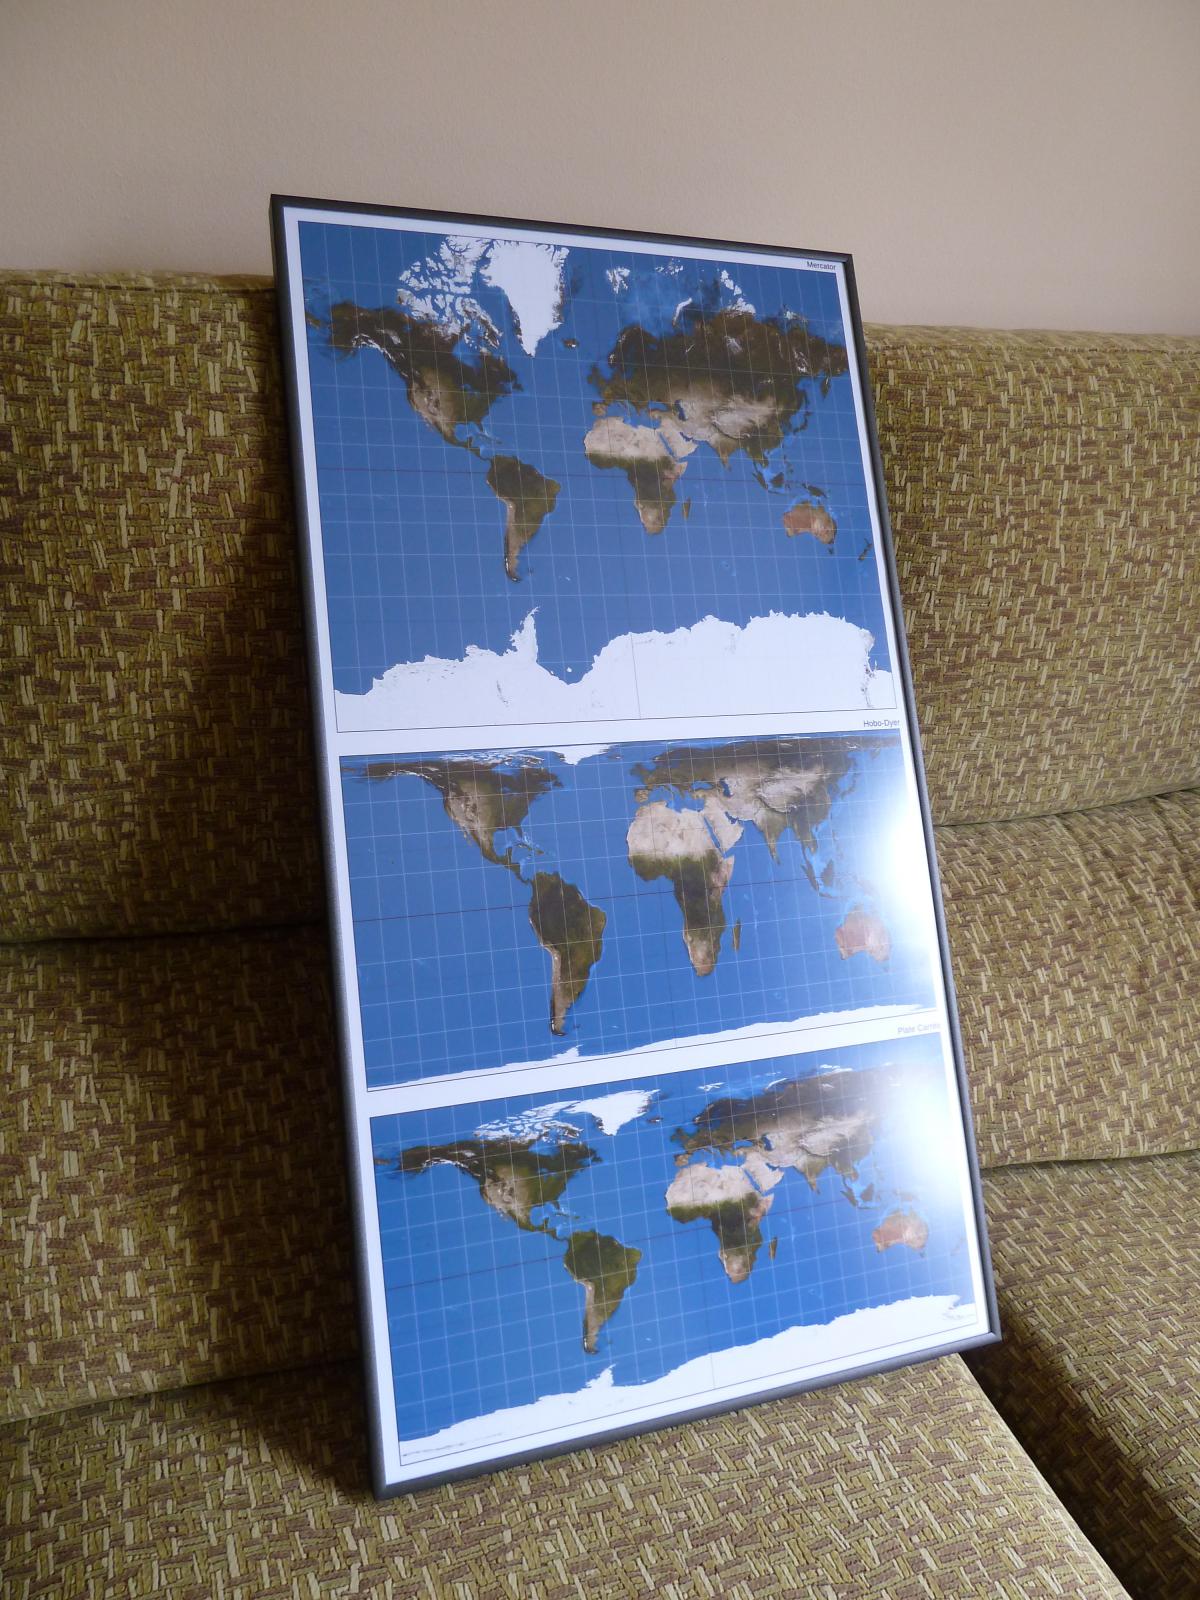
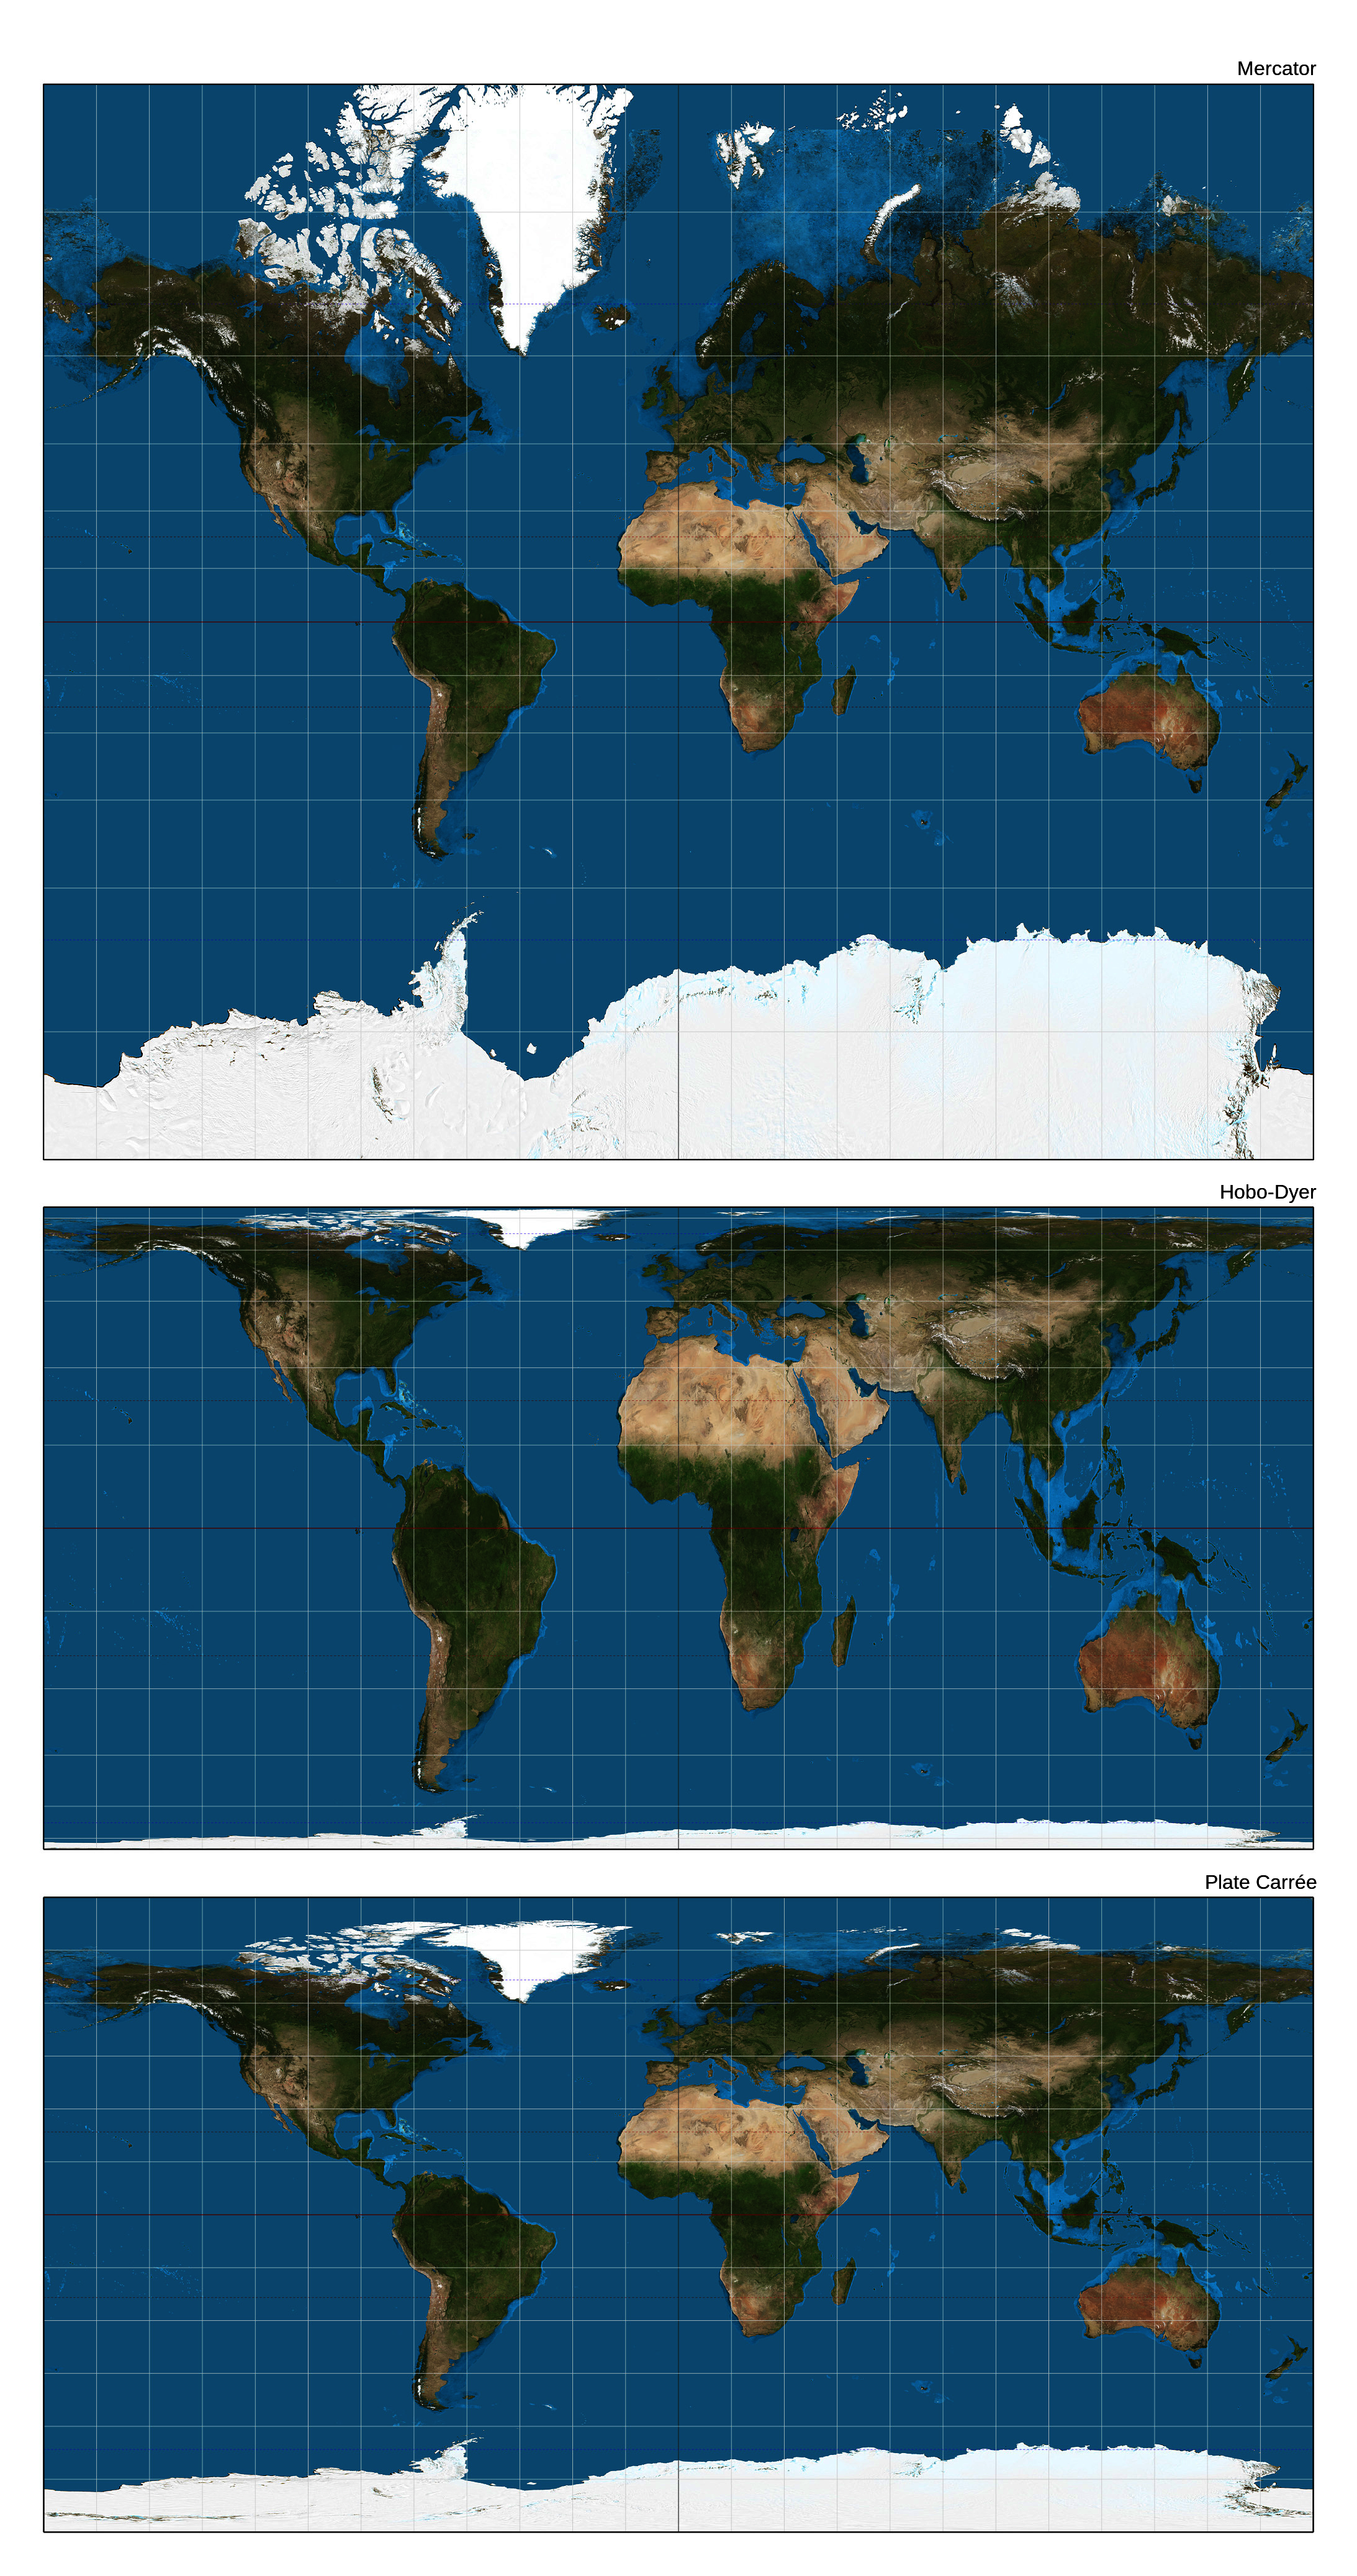
I didn’t have any world map in my study and didn’t want to buy a globe because it takes too much space and has its disadvantages too, so I decided to compose an image with the most significant projections. I had it printed and framed, and will now hang on the wall.
The projections chosen were:
-
Mercator, for its ability to present rhumb lines as straight lines. This is a classic and needs no explanation.
-
Hobo-Dyer for its ability to preserve the area.
-
Plate carrée for its ability to preserve distances along meridians.
Hobo-Dyer is maybe the only one that has to be justified. My other candidate was Mollweide, which looks pretty good and is not overly complicated. However, when you look at a Mollweide map it looks like a 3D object. The areas are right exactly as they are, but you mentally tend to interpret what you’re seeing as a 3D object and mentally undo the apparent distortion near the edges, which doesn’t have to be undone.
Gall-Peters, on the other hand, carries controversy with it abroad, from what I’ve read online, even if no regular person seems to know it where I live. This means I had to settle with a non-Gall-Peters rectangular projection and I went with Hobo-Dyer.
The original image I printed was composed from the full-resolution images found at Wikipedia. They are released under the Creative Commons Attribution-ShareAlike 3.0 Unported license. Likewise, my mere composition of them is released under the same license.